Toggle shortcut for Greyscale display mode
-
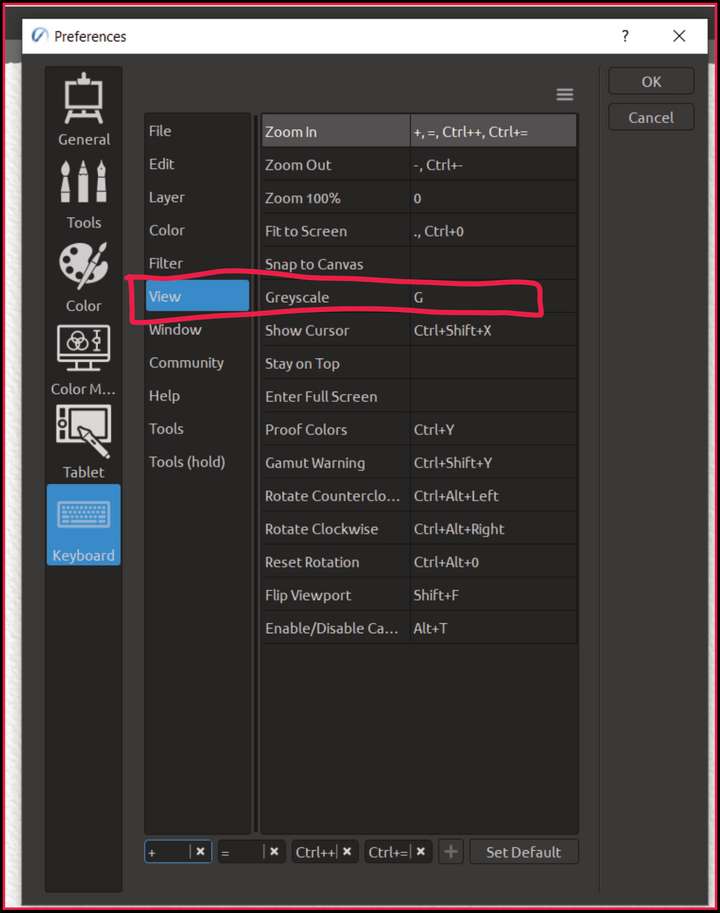
Rebelle 5 has a great feature - it provides toggle shortcut key (in this case G) for instantly turning on the Greyscale display mode.
It is used for checking the values, contrast and balance of an artwork. I know that many artist would just kill for this feature
")
I found this mode in View\Display\Display Options, but could it be a toggle shortcut or icon with Display Modes?
-
@Harry Could be added as a display mode along with [outline, pixel, vector].
-
Great to hear that!
-
As a photographer interested in black and white photos I am amazed I never came up with the idea or used this to check out the artworks dynamics and punch.
@Harry Is is simply called greyscale mode in Rebelle? It's a rather dull term that is correct, but doesn't really refer to its purpose (in this case).
-
And wouldn't a histogram be of some value here?
-
@Ingolf said in Toggle shortcut for Greyscale display mode:
As a photographer interested in black and white photos I am amazed I never came up with the idea or used this to check out the artworks dynamics and punch.
@Harry Is is simply called greyscale mode in Rebelle? It's a rather dull term that is correct, but doesn't really refer to its purpose (in this case).
It is called Greyscale in Rebelle:
In illustrations, painting etc. this technique is very useful - it's like toggling between mono and stereo during mixing music
-
@Ingolf said in Toggle shortcut for Greyscale display mode:
And wouldn't a histogram be of some value here?
For photographers - absolutely!
For painters and other artists - not really - as it seems that they have histogram built in the eye

-
@Harry said in Toggle shortcut for Greyscale display mode:
@Ingolf said in Toggle shortcut for Greyscale display mode:
And wouldn't a histogram be of some value here?
For photographers - absolutely!
For painters and other artists - not really - as it seems that they have histogram built in the eyeNot if they need this grey scale mode, hint hint.
After all, photographers simply use a histogram to seek out the dynamics and contrast of the image too. Most programs also show the light (luminosity) distribution over the dynamic range in the histogram which gives a very good impression of the image. When you're good at histograms, you can simply work out backwards from the histogram why the image doesn't have enough punch or is too one-sided. It is not only used to check exposure.
-
@Ingolf said in Toggle shortcut for Greyscale display mode:
Not if they need this grey scale mode, hint hint.
That's good! I like it!
Histogram built in the eye means also to squint - try it and you'll learn a new habit
Seriously speaking - @Ingolf - could you recommend some free app to play with histogram?
@VectorStyler - can we add histogram to the roadmap? Or would it be a part of (maybe possible) future "PhotoStyler"?
-
@Harry To show histogram of a vector document? or a "Levels" filter?
-
I understood the monotone request but adding a levels adjustment feels like a step too far outside the vector realm. We’re getting into pixel based feature creep! If we eventually get a “pixelstyler” program, this feature would make total sense. Just my opinion
-
@Boldline said in Toggle shortcut for Greyscale display mode:
adding a levels adjustment feels like a step too far outside the vector realm.
You may be right. I'm not insisting.
Win 11, XP Pen Deco 01 V2 graphic tablet
-
I will provide examples later today or tomorrow. No levels adjustment here, just illustration of the distribution of luminosity across the entire illustration as a graph - seeing the art as monocrome is related, a graph just illustrates the actual distribution of luminosity which will provide you with an idea about the distribution of light or darkness across the dynamic range and a clue to why what you see appears flat or perhaps the opposite.
Not execptionally need to have - but very useful, especially when you monitor or laptop screen (or the psysical environment you are in, bright sunny day in a airport terminal) is not great for the purpose of inspecting with your eyes.
-
@Harry said in Toggle shortcut for Greyscale display mode:
You may be right. I'm not insisting.
Just my opinion.
We're all just sharing our ideas freely, which is a great thing. I appreciate that you share your thoughts on here. The more we all contribute, the more likely the best overall ideas filter up for the developer to decide what and how to implement. -
Here we go. A luminosity histogram is easier to decode when working with pictures because so many pixels are in play with various luminosity values. Fx:
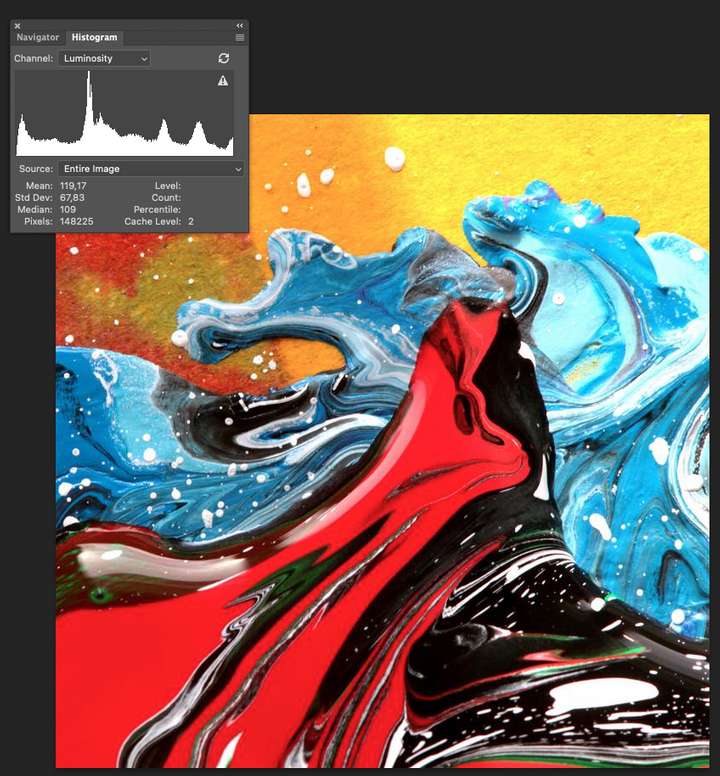
But historgrams do tell you a lot about the distribution of light in genereal across the dynamic range from absolute black to absolute white. When working in bright sunlight (with a camera) I would have inspected the histogram here and seen that the picture is correctly exposed. But I can also read from that graph that this is indeed a picture with punch.
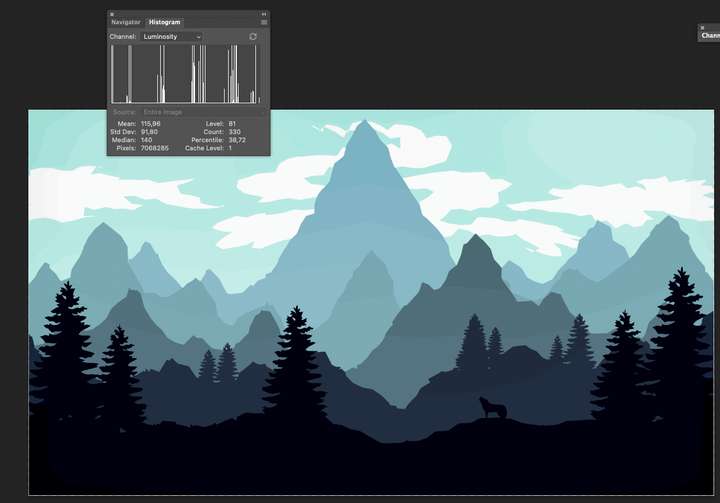
This picture below is (originally) vector, and as you can see the histogram reflects that few colors are in play - but you can see that the dynamic range is used fully and that the picture has some punch as well - the entire dynamic range is in use.
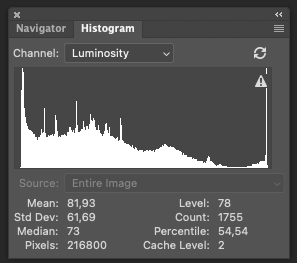
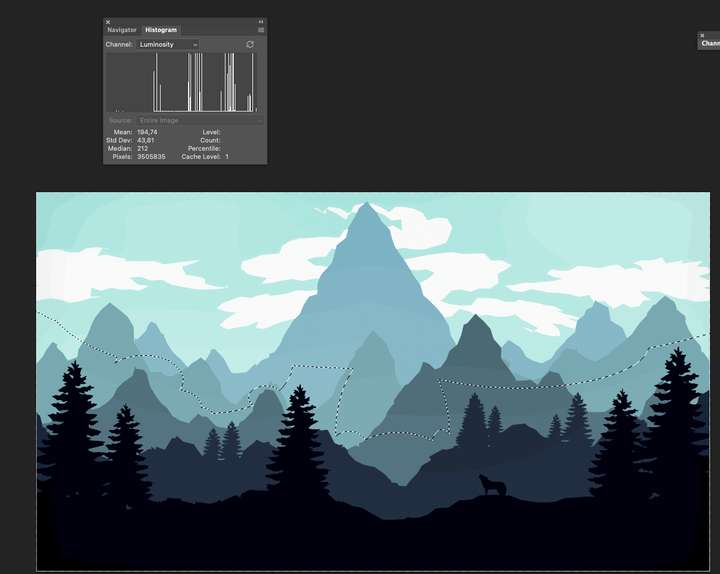
Let us play that the selection here is a layer and it is the only visible layer for now - the histogram reflects it (left side of histogram):
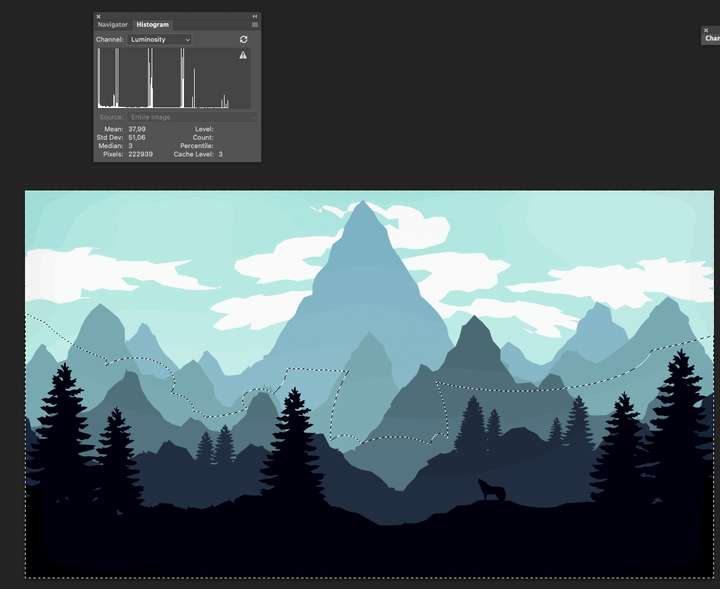
and the shadow section of the image (right side of histogram):
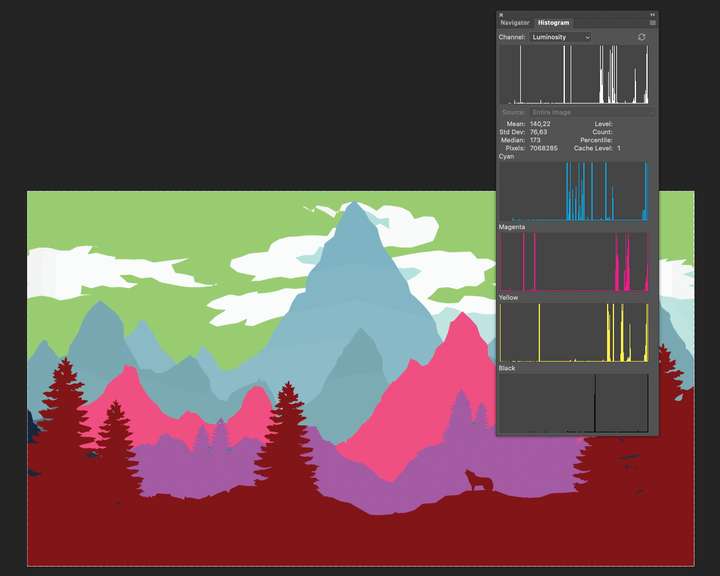
Or what about info about the individual CMYK channels (made som edits to the image to make differences more obvious in histogram):
Just some examples from Photoshop where it is all bitmap and perhaps a simpler graph to generate. Not sure if it much value in VS, but now that I can inspect an image in grayscale I thought this info could be useful as well. It is after all much of the same just as numbers and facts. And oh could probably be used without actually enabling monocrome preview.
Preview: trust your monitor and eyes
Graph: numbers, details and facts -
@Ingolf The problem with Histograms on vectors is that it requires rendering first and then collecting the histogram of the result (there are effects, gradients, opacity, etc).
But in this case, the rendering is only available for what we see on the screen, which is not always the whole thing.One option is to have a "slow" histogram feature, that is either modal, or needs manual updating.
There is "vector" histogram in VS (the color -> levels filter), but this one counts the objects using a color and it is not what is needed here.
-
@VectorStyler Yeah I thought so - it is not that important after all. Perhaps more of a preflight thing.
I wouldn't expect a real time updated histogram - I could easily live with a static one with a 'refresh' button.
Anyway, not at all important. I just thought that it would be interesting as well for those who would be interested in a monochrome preview. And somewhat of a 'first'.
-
@Ingolf said in Toggle shortcut for Greyscale display mode:
I could easily live with a static one with a 'refresh' button.
This is easily doable, as image histogram extraction and histogram view (separately) already exists.